Products
Solutions
Resources
9977 N 90th Street, Suite 250 Scottsdale, AZ 85258 | 1-800-637-7496
© 2024 InEight, Inc. All Rights Reserved | Privacy Statement | Terms of Service | Cookie Policy | Do not sell/share my information

Within each register, you can move, sort, filter and group your columns to view the information the way you need to see it.
You can move columns by selecting a column header and using drag-and-drop. If there are columns on the register that you don’t use, you can hide and unhide them from view, as needed.
In the CBS, click on the Currency column header and drag the column to the left, dropping it to the right of the Description column.
Hide the Optional Code column by dragging the Optional Code column header down until a black X appears, then let go.
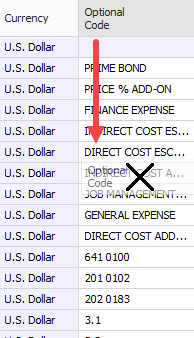
The Optional Code is now hidden from view
To unhide a column, right click on any column header and select Column Chooser; a Customization window appears, which contains all the hidden columns in that register
Find the column you want to unhide and drag-and-drop it to the location where you want it to go.

You can also unhide a column using the Go To Column feature
Right click on a column header and select Go To Column.
Click on the drop-down menu and select the column you want to unhide.
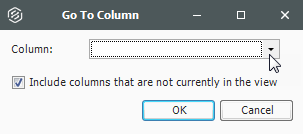
Click OK.
You can sort and filter your columns to drill down to specific information.
You can sort on any column by clicking once on the column header.
In the CBS Register, click on the Total Cost (Forecast) column to sort the column in ascending order (e.g., 1 to 10, A to Z).
Click the Total Cost (Forecast) column a second time to sort in descending order (e.g.,10 to 1, Z to A).
Use Ctrl-click to unsort a column and reset it to its original state.
In the CBS, hover over the Unit of Measure column header for the filter icon to appear.
Click on the filter icon in the Unit of Measure column to select a filter value.
From the filter list, you can select any of the values defined for that column or you can use one of the predefined values (Custom, Blanks, Non blanks).
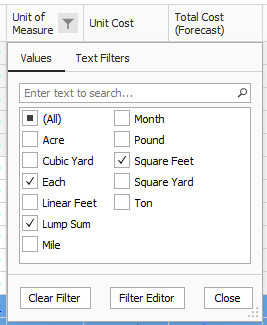
Make your selection, then click Close.
To clear the filter, click on the red X at the bottom of the form or click on the filter icon on the header of the column you filtered and select (All), then click OK.
Column filters can be managed on individual columns or for the entire register using the Filter Editor. The Filter Editor tool lets work with all the column filters for a register view in one place as well as creating more complex filters through the use of grouping and applying And/Or statements.
When you add a new Group, a new Condition is automatically added to that Group.
With each additional Condition statement, you need to select an operator and a value in order for your customized filter to take effect on your chosen column. Many new comparison operators have been added to this version as shown below:

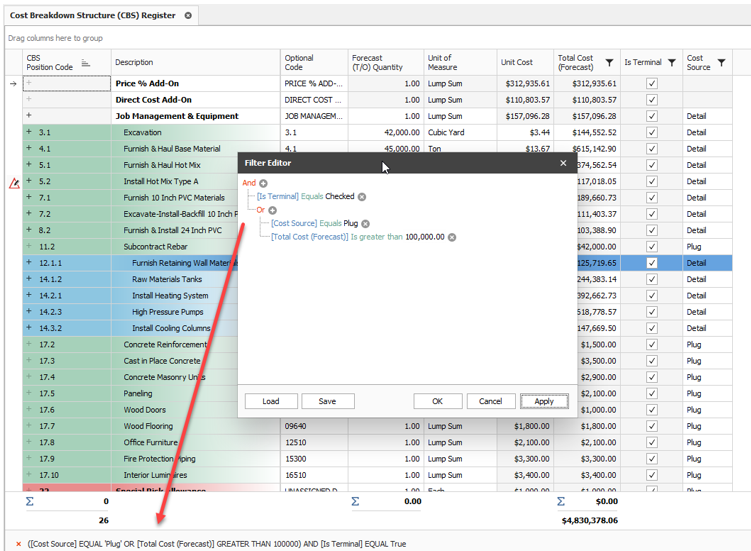
You can define filters across any of the columns available in the CBS register. You can also open the Filter Editor using the button in the column filter drop-down, but regardless of how you access it, the Filter Editor dialog permits defining a filter for the entire register and not just the selected column.
Because all the register fields are available, more complex filters can be created by using Grouping and Or operators. In the following example, a filter has been defined to return all Terminal Cost Items that either have a cost source of Plug, or exceed $100,000 of Total Cost (Forecast).
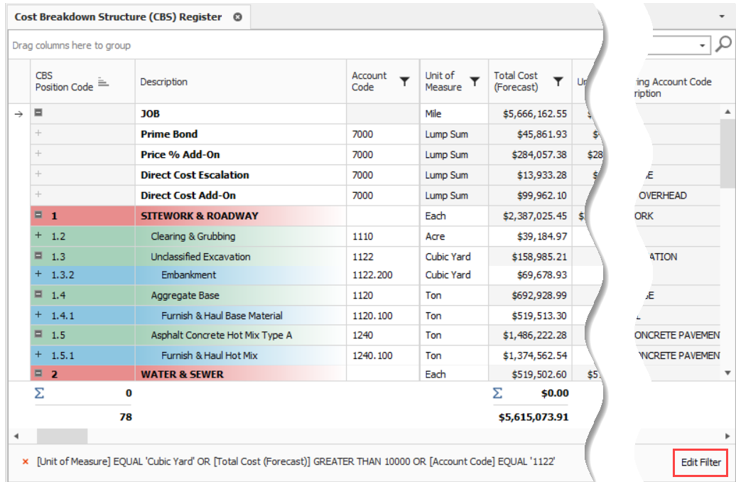
When modifying a filter, the Filter Editor can be invoked by clicking the Edit Filter button located on the bottom right of the CBS page.
In the CBS, hover over the Unit of Measure column header for the filter icon to appear.
Click the Filter icon in the Unit of Measure column to select a filter value; select the desired UoM.
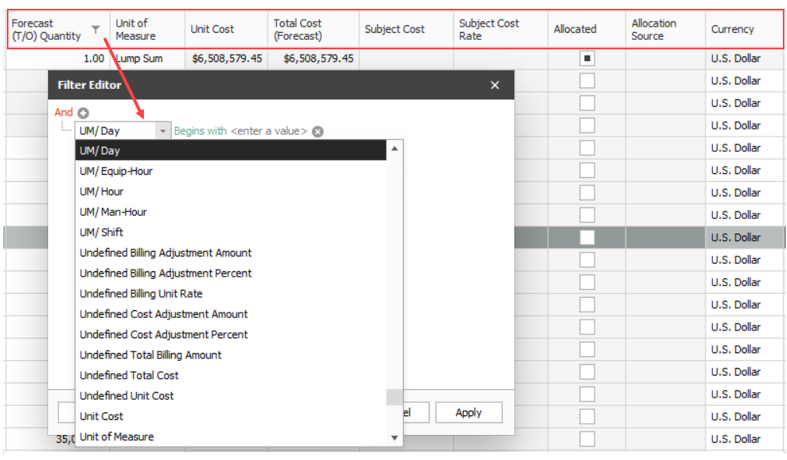
Select the Filter Editor button, and the Filter Editor data box appears.
Select your preferred operator and enter in your preferred value.
To add additional And/Or statements, select the word And in the top left corner. A drop-down appears.
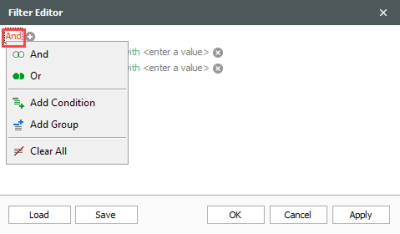
Click OK.
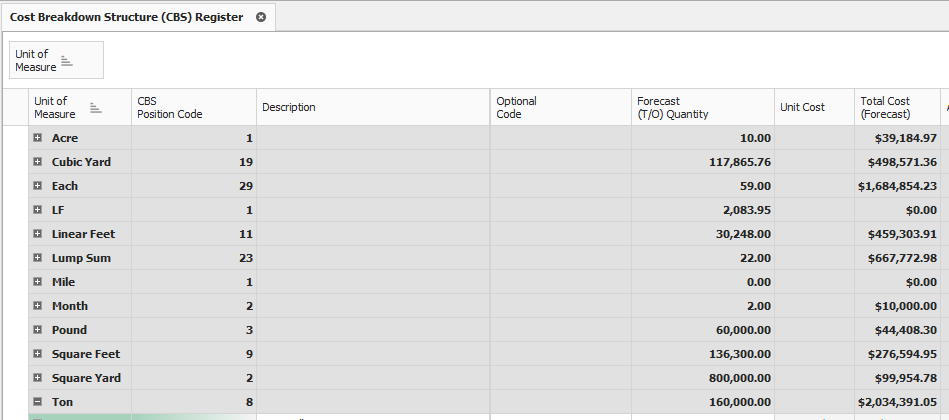
Sometimes you may want to organize your information into groups. Instead of filtering your information down to one value (e.g., unit of measure = Ton), you can look at your information with a separate group for each value (e.g., a group for Tons, a group for Cubic Feet, etc.).
From the CBS register, group the Unit of Measure column by dragging it into the grouping area (where it says “Drag columns here to group”).
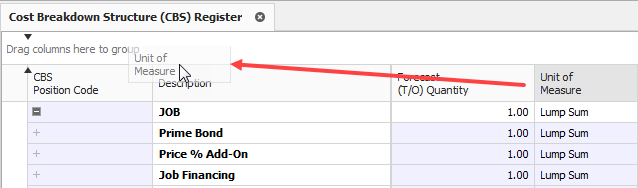
Notice that the cost items in the register are now grouped together by their units of measure, and each group of cost items is subtotalled by costs, hours, quantities, etc.
To ungroup, right click in the grouping area and select Clear Grouping
The column returns to its original location
You can group by more than one column to have multiple grouping levels.
Once you have set up a view the way you like it, you can save the view so you won’t have to configure it again later. InEight Estimate also comes with some pre-built views to help you organize the screen the way you want to see it.
Views are accessed from the Saved Views menu in the top right portion of a register.
The following steps assume you have made changes to your register view and want to save it for future use.
In the CBS register, click on the Saved views drop-down menu. The Save disc icon shows.

Click the Save disc icon. The Save Current View window shows.
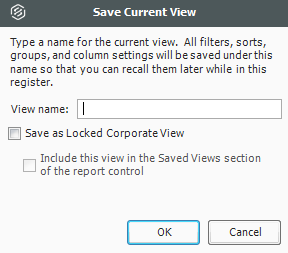
Enter the View name, and then select OK. The new view shows in the drop-down menu.
Saved views are user-specific; you will only see your own saved views when you are logged in.
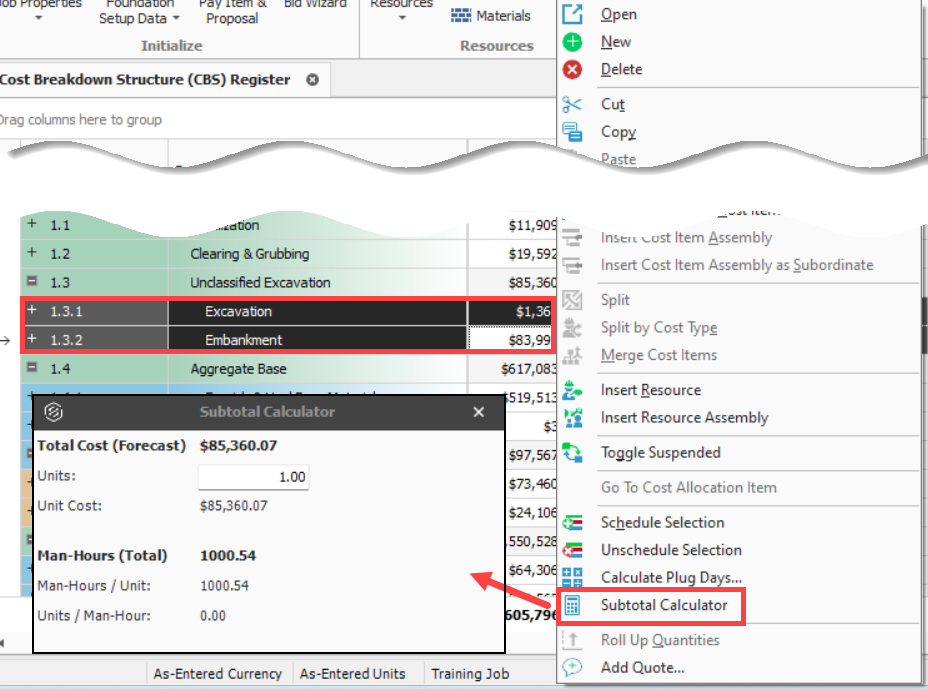
You can select multiple cost items and use the Subtotal Calculator to summarize and display Unit Cost, Man-Hours/Unit and Units/Man-Hour. Highlight a cost item in the CBS and right click on a Total Cost column (e.g., Total Cost (Forecast), Labor Total Cost, Owned Equipment Total Cost, etc.). Select Subtotal Calculator from the right click menu, and enter the number of units to use in your calculation.
You can select multiple rows in a register and see the sum total amount at the bottom of the register.
For example, you can hold down the CTRL key and multi-select cost items 2.1.1, 2.2.1, and 2.3.2 in the CBS register, you can see the sum of the three selected cost items toward the bottom row of the register.
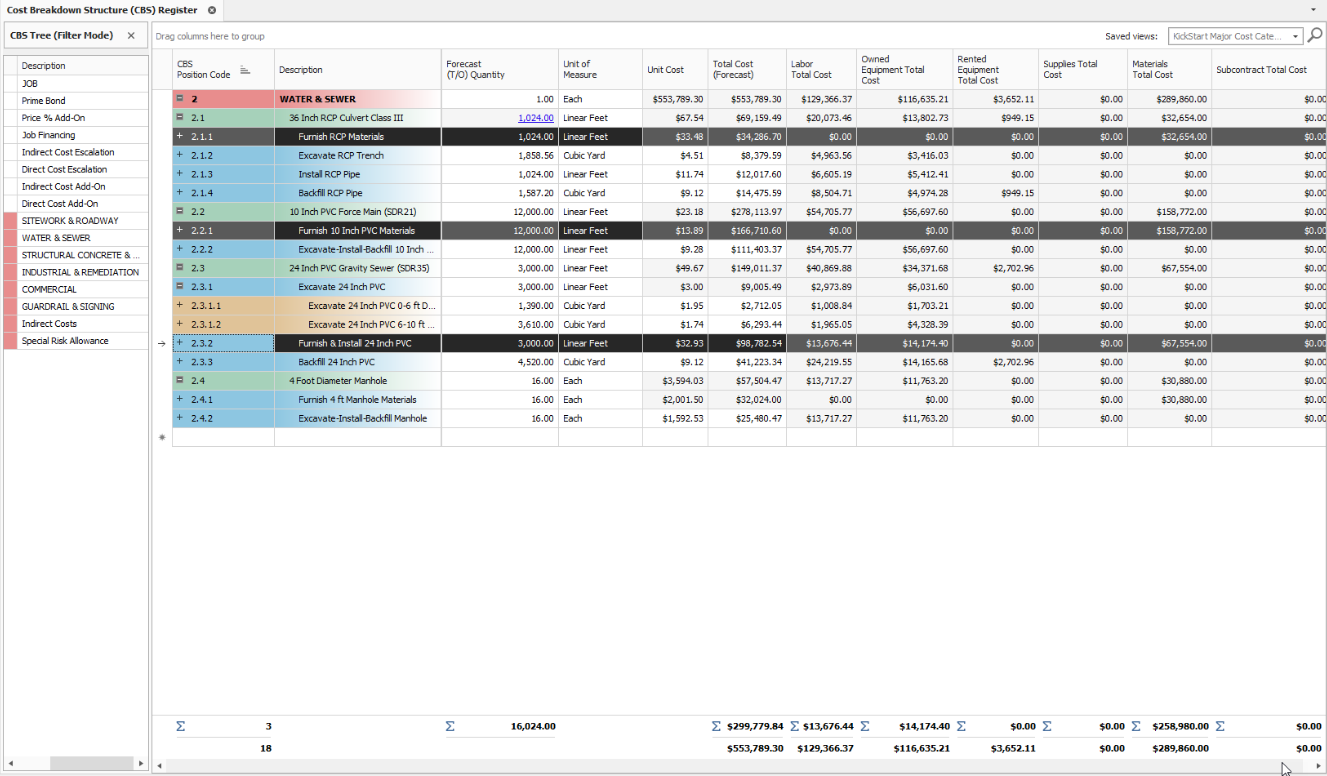
Estimate calculates subtotals for quantities when the UOMs match. Superior cost items are not included in the subtotals to avoid any double counting in the subtotal.
It is not necessary to export data to Microsoft Excel and run separate calculations to better understand costs of multiple items. The sigma symbol shows in the subtotaled row to indicate it is the total of the selected rows.
Additional Information
9977 N 90th Street, Suite 250 Scottsdale, AZ 85258 | 1-800-637-7496
© 2024 InEight, Inc. All Rights Reserved | Privacy Statement | Terms of Service | Cookie Policy | Do not sell/share my information